415. Learning about the riskiness of a new farming practice
When considering whether to adopt a new farming practice, there are various aspects of the practice that farmers would like to learn about. One of those is how risky the practice is.
Does it perform reliably and give consistent results (low risk), or do its results vary from time to time (higher risk)? If it is replacing an existing practice on the farm, is the new practice more or less risky than the old one?
For example, back when canola was emerging as a good option for grain growers, one question would have been whether canola was more or less risky than whichever crop or pasture type it replaced in the rotation.
These questions are obviously relevant if the farmer is risk-averse (see PD409). The more risk-averse the farmer is, the more motivated he or she would be to know about how risky the new practice is.
But how easy is it to learn about how risky a new practice is? I think it is likely to be relatively difficult in many cases.
Suppose that Dave the risk-averse crop farmer has signed up to Australia’s carbon credit scheme and is trying to sequester more carbon in his soils to earn ACCUs (carbon credits). He has switched some of his cropland into permanent pasture, which is one of the actions recognised in the scheme for sequestering carbon. He doesn’t have any previous experience with soil carbon sequestration, so he doesn’t know much about how risky soil carbon sequestration is. He has signed up to the scheme despite his ignorance of the risk, but now he’d like to learn how risky it is.
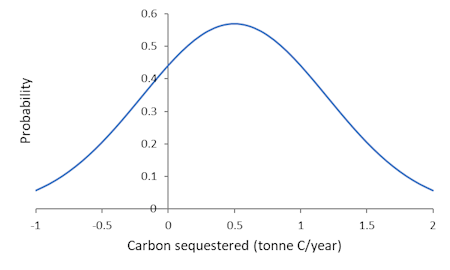
Suppose that somehow I know the true probability distribution of carbon sequestration per year for Dave’s soil type in his region. (Remember, risk is about probability distributions – see PD406.) The distribution is shown in Figure 1. The mean of the distribution is 0.5 tonnes of carbon per year, but it is highly variable from year to year, with a standard deviation of 0.9, so it could be negative or highly positive in any year. Dave doesn’t know that this is the distribution. He’s going to learn about it from experience.
Under the rules of the ACCU scheme, Dave chooses to sample his soils every five years. ACCUs will be issued depending on how much new carbon has been sequestered over the previous five years.
His measurements in year 6, 11, 16 and 21 turn out to be 1.51, -1.19, 3.65 and 0.64. (These are total levels of sequestration for the previous five years.) Dave’s now been taking measurements for 20 years. How much do you think he know about the riskiness of soil carbon sequestration? I’d say, not much.
From those four measurements, the mean sequestration per five years is 1.15 tonnes, but Dave can’t have confidence about what he’ll get in future. I generated five other 20-year random sequences of sequestration consistent with the probability distribution in Figure 1, and instead of 1.15 tonnes/5 years, I got means of 3,79, 2.90, 2.41, 4.0 and 2.11. Each sequence of 20 years is quite different.
The apparent riskiness of sequestration is also quite different for each 20-year sequence. The original sequence of carbon measurements (1.51, -1.19, 3.65, 0.64) has a standard deviation of 2.01. (Standard deviation is a measure of the variability in a set of numbers.)
For the other five sequences I generated, the standard deviations are 1.49, 3.77, 2.10, 0.65 and 2.16. That gives you a sense that the initial set of four observations tells Dave little about the long-run variability of soil carbon sequestration. For all he knows, the variability in future might be much higher or much lower than what he’s observed in the first 20 years.
Of course, the longer Dave goes on measuring soil carbon, the more he’ll learn about the probability distribution, but hopefully, the examples above give you a sense that it will take quite a large number of observations to get a reasonably accurate reading on the distribution. (By then, it will have shifted because new sequestration tends to fall over time, but that’s another story.)
This means that when farmers are considering new practices that are somewhat different from their previous experiences, they are often making decisions without strong knowledge of how risky those practices will end up being.
This highlights the importance of uncertainty, as opposed to risk, but that’s a topic for a future post.
The story above is affected by how similar the new practice is to an old practice. If the new practice is expected to be similar to an old practice in its risk behaviour (e.g., a new wheat variety replacing an old one), the farmer can much more quickly get a good understanding of the riskiness of the new practice. This is because there is a well-understood benchmark with which the new practice can be compared. Given that the influence of price and production risk factors would be similar for the new and old varieties, it is relatively easy to learn whether the standard deviations of yield are different.
But if the farmer’s past experience doesn’t provide them with a good benchmark for interpreting the performance of the new practice, learning about the average performance and riskiness of the new practice is relatively difficult and slow.
Further reading
Marra, M., Pannell, D.J. and Abadi Ghadim, A. (2003). The economics of risk, uncertainty and learning in the adoption of new agricultural technologies: Where are we on the learning curve? Agricultural Systems, 75(2/3), 215-234. Journal web page
We also touch on the issue of risk in adoption decisions in this paper:
Pannell, D.J., Marshall, G.R., Barr, N., Curtis, A., Vanclay, F. and Wilkinson, R. (2006). Understanding and promoting adoption of conservation practices by rural landholders. Australian Journal of Experimental Agriculture 46(11): 1407-1424. Journal web page * Book chapter version The latter is from Pannell, D.J. and Vanclay, F.M. (eds) (2011). Changing Land Management: Adoption of New Practices by Rural Landholders, CSIRO Publishing, Canberra.
This is #9 in my RiskWi$e series. Read about RiskWi$e here or here.
The RiskWi$e series:
405. Risk in Australian grain farming
406. Risk means probability distributions
408. Farmers’ risk perceptions
409. Farmers’ risk preferences
410. Strategic decisions, tactical decisions and risk
412. Risk aversion and fertiliser decisions
413. Diversification to reduce risk
414. Intuitive versus analytical thinking about risk
415. Learning about the riskiness of a new farming practice (this post)
416. Neglecting the risks of a project