277 – Perfection isn’t best
In whatever work we do, a common challenge is deciding how much effort to devote to a particular task. Additional effort will usually generate more output or better-quality output, but at what point does the cost of extra effort outweigh the benefits? It might be a lower point than you think.
A standard model from production economics provides some useful insights into this issue. The model represents a firm’s decision making about a production input. A classic example from agriculture is a farmer’s decision about how much fertiliser to apply to a wheat crop. I’ll go through this example and explain the insights it gives us. Later on, I’ll show how the same insights are often relevant to completely different types of work, such as writing a report or studying for an exam.
Looking at the fertiliser example for now, the question is, how much fertiliser should a farmer apply in order to get the outcome that is best overall?
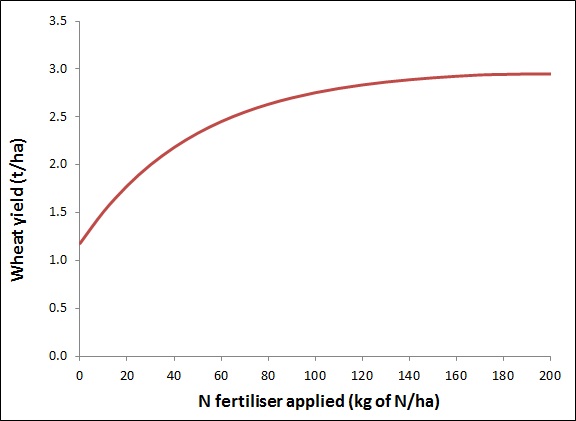
The higher the rate of fertiliser applied, the higher the level of wheat production. However, the relationship between the input (fertiliser) and the output (wheat grain) is unlikely to be a straight line. It’s more likely to be shaped like Figure 1: as the level of input increases, the level of output increases but it tends to flatten out. Whatever its shape, economists call the relationship between an input and an output a “production function”.
Figure 1. A production function for fertiliser applied to a wheat crop.
Suppose the planned level of fertiliser in Figure 1 is low – say 20 kg/ha. As the graph shows, if the farmer increased the rate from 20 to 40 kg/ha, there would be quite a large increase in wheat yield. On the other hand, if the planned fertiliser rate was 120 kg/ha, increasing it by another 20 kg/ha would increase yield by only a small amount. At 200 kg/ha, a further increase in fertiliser would make no difference to yield (in this example).
There have been countless thousands of fertiliser trials conducted around the world, and the great majority show a shape like Figure 1 – steep at low fertiliser rates, flat at high rates.
One possible answer to the question, “what is the best rate of fertiliser?” would be, “the rate that gives the highest yield”. In Figure 1, the yield is maximised at 200 kg/ha.
The problem with this answer is that it ignores the cost of the input. Clearly, fertiliser is not costless.
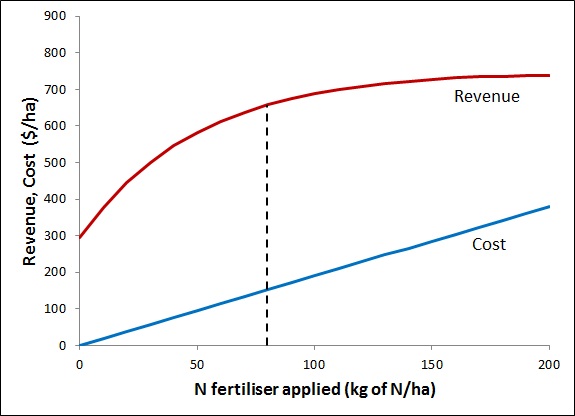
Figure 2 shows the farmer’s revenue from the harvested wheat crop and the cost of the fertiliser that has been applied (all calculated per hectare). The revenue curve is the crop’s yield (from Figure 1) multiplied by its sale price (which I’ve assumed is $250 per tonne in this example). The cost curve is the cost of fertiliser ($1.90 per kg) times the rate of fertiliser applied.
Figure 2. Revenue and cost from wheat production at different fertiliser rates.
At any fertiliser rate, the benefit to the farmer (the profit) is the revenue received minus the cost of fertiliser. On the graph, the profit at a particular fertiliser rate is the vertical distance between the revenue and cost line at that fertiliser rate. You can see that if no fertiliser was applied, the benefit would be $300 per ha (the distance between the red and blue lines at the points where they hit the vertical axis, where fertiliser rate is zero). If the fertiliser rate was 80 (where the dashed line is), the vertical distance between the red and blue lines is a bit over $500, so 80 is clearly a better option than zero. At rates above 80, the revenue and cost lines get closer together, meaning that the overall benefit is less than at 80. In fact, 80 is the best possible input level in this example. It gives the highest profit to the farmer.
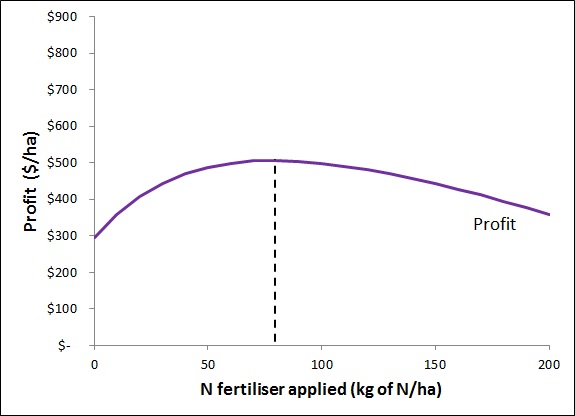
Figure 3 shows the farmer’s profit at different fertiliser rates. It is the difference between the two lines in Figure 2. In this graph it’s easy to see that the maximum profit is generated at 80 kg per ha of fertiliser.
Figure 3. Profit from wheat production at different fertiliser rates.
It’s also easy to see that the fertiliser rate that maximises crop yield (200 kg/ha) is not the rate that maximises profit. The reason for this is that, at rates above 80 kg/ha, the revenue from the additional grain isn’t enough to cover the cost of the additional fertiliser. In fact, at 190 kg/ha, increasing the fertiliser rate up to 200 kg/ha gives basically no additional yield at all, only additional costs (see Figure 1).
Figure 3 also shows that the profit function is quite flat in the vicinity of the optimum (80 kg/ha). Any rate between say 60 and 100 kg/ha gives very nearly as much profit as does 80 kg/ha. (See PD#88)
As promised earlier, let’s look at other types of outputs and inputs and see how this model is relevant. Economists have found that the shape of Figure 1 (or something like it) is relevant to many types of physical production processes. Just Google “production function” and you’ll see that this is the default assumption in the absence of evidence to the contrary. In all these cases, the optimal input level is less than the level that maximises output, and there is a range of input levels that are almost as good as the optimum.
What about work that doesn’t create physical products? In most developed countries, the service sector constitutes 70 to 80% of the economy. How relevant are the above conclusions to activities in that sector, like analysing some data, writing a report, marketing a product, or designing a building?
My proposition is that the shape of the production function in Figure 1 is very often relevant to these sorts of activities as well as to physical production processes. Consider the process of writing a report. It’s a common experience to find that one can prepare a report to a reasonable standard with a moderate amount of work, but further improvements in the standard of work take increasing amounts of work. As the report approaches perfection, there is a risk of continuing to work on it almost indefinitely without any real improvement in its quality. Clearly, this is just like the fertiliser example, with the main difference being that I’m focusing on the quality of the output rather than its quantity.
If that’s so, then it must also be true that the ideal level of effort to put into this type of work is less than the amount needed to produce a perfect report. Aiming for a 98% or even 95% perfect job (rather than 100%) will produce an output that is good enough in the majority of cases, and will allow you to move on more quickly to other work. For some people, adopting this as a conscious strategy can greatly increase their efficiency at work, especially people with strong perfectionist tendencies.
Of course, sometimes 95% really isn’t good enough. If a report is particularly important and will be carefully scrutinised, you might decide to aim for 99.9%, but even in these special cases, it is unlikely to be optimal to aim for 100%.
Further reading
Pannell, D.J. (2006). Flat-earth economics: The far-reaching consequences of flat payoff functions in economic decision making, Review of Agricultural Economics 28(4), 553-566. Prepublication version here (44K). IDEAS page here.


David,
You have done crop farmers a great service by ‘producing’ these numbers. Let us hope that those who advise farmers also read them and take note. W have been on a productivity rather than a profitability binge for too long.
I hope you don’t feel this last comment detracts in any way from what you have written, because in my view it cannot be repeated often enough. The first time I saw numbers and graphs similar to those in your article was while a student at an agricultural college in England in 1962.
What does worry me however, is that in spite of the level of our inputs there distinct signs, with the effect of drought removed, that wheat yields both in WA and nationally are in decline and the extent of the rural debt, without the recent disaster in Qld, is well known.
Another way of looking at the challenge is deciding how much effort to devote to a particular task is “how wrong can you afford to be?” (based on the expectation that getting a solution ‘righter’ gets progressively more expensive the ‘righter’ one wants to be…).
Think about getting to an airport to catch a plane – getting there early is a (comparatively) low cost option; getting there late may mean missing the plane and forfeiting the fare. Consequently, a rational approach is to err on the side of getting there early.
Similarly with crop inputs, setting the ‘appropriate’ rate of fertiliser application is easy at the low end where the rewards are greatest (based on the production function provided) and agonising over the ‘right’ rate at the higher end may be effort wasted as other uncontrolled variables come into play.
Some tasks “near enough is good enough”; others ain’t so!
I am always fascinated by people’s desire to have precise and confident numbers in relation to fertiliser rates, nitrogen in particular as there is little residual value if you put too much on and in the case of nitrogen production declines if too much is applied as well as an increase in screenings. The profit response to applied fertilser as above is the basis for most fertiliser decision support tools in WA.
The most important point is the relative insensititivity of profit to fertiliser rate when rates are near the optimum. The big trick is be confident that you are close to the optimum so that if seasonal conditions are better or worse than expected, the profit generated remains on the flatter portion of the response curve.
I concur with the sentiment of optimising effort or cost for the necessary result which can be applied in many situations like gathering precision data and decision support tools. Maybe perfection is the domain of hobbyists.
An old wheatbelt proverb – “A lot of cockies waste money on super (or many things for that matter) but those who do are rich”.
I like Les’s comment on catching a plane. Unfortunately it applies equally to writing a report. If you miss out on a first class honours by sloppy report writing you suffer for the rest of your life.
Car manufacture is another interesting example. The damage occasioned by a less than perfect car reflects on the company and further sales. So all relevant costs need to be inserted when formulating the input and output curves. This latter can apply to farmers’ fertiliser use. Think of groundwater contamination.
As Les said, “Some tasks “near enough is good enough”; others ain’t so!” That’s what I said. You have to use your judgement. Even then, I still hold that the cost of achieving perfection in a complex task is effectively infinite, so it’s almost never sensible to aim for that. It’s always about choosing what risk of error you will accept.
I discuss this document with my colleagues who want me to thank you for making available it.
Thanks. It is a real decision tool.
Great piece. Keep up with the good work.
I like the graph and how it can be so useful to the producers, I just wonder if one would like to establish a basis for the relationship in a specific location, can this remain as fixed figure to help all farmers from such area to use same reference. I want to know exactly if we can use same approach to establish the value for every increased input in relation to production. So doing I can advice the farm managers that if you apply this amount of fertilisers you will harvest this amount. Is that so?If so then how comes that I have not managed to see its actual application?
The specific shape of the production function varies depending on the circumstances. For agriculture, it depends on the soil type, the rainfall, the presence of pests or weeds, the levels of other inputs, and so on. For a particular farmer growing a crop in a particular field, the production function moves around from year to year. So in reality it is not a single line, but a probability distribution of yields at each fertilizer rate. You could think of the line as tracing out the mean yield for each fertilizer rate. Some farmers would be happy to make their decisions based on that mean line, but others are concerned about risk and so would like to know how reliable the profit is at each fertilizer rate.
In some places, scientists have collected data from fertilizer field trials for quite a few years, allowing them to provide good quality advice to farmers about fertilizer rates. I would not provide such advice based on only one or two years of data, because conditions are so variable from year to year.
Dave,
I’m greatly driven by the diminishing marginal returns.Here I always thought that if I add a lot of fertilizer the more grain I will produce.Thanks.
my thinking before was if added a lot of fertilizer the more grains i will produce…….thank you
the post is very interesting and basically it is showing a actual fact that everything that has to be used needs to be used in an appropriate quantity. This doesn’t means that if you use more quantity you will get more better result. Like in this post the more use of fertilizers doesn’t gives a higher yield of the crop. Putting a unit of amount of input which is fertilizer will give you high yield rather it will reduce it and in future one time will come when there will be no change in the yield even if you put more input to get a better output. In this post actually the concept for declining marginal product is shown which is basically a term used in economics. So from my pint of view also the title for the post is best and even I also think that input should be used in a appropriate amount rather than using it more in a hope of getting a better and more yield.
Dear Dave, I would be grateful if you could supply examples of how to formulate the yield production function to use in our excel spreadsheet. I am of the view that once this is known we will be able to localise it to our situations back on the farm and on a per land by land basis. Thanks Dave. Great concept.
Hi Collen. I’m guessing that you are enrolled in my course “Agriculture, Economics and Nature” on Coursera.org. If you are, you can get further advice about this by looking at the Discussion Forum for week 3 of the course. If you are not already in that course you could enrol for free here: https://www.coursera.org/learn/agriculture-economics-nature
Dear Dave, It was a excelent lecture and lead me think about that this 5 to 10 % of addiotional effort or work to complete the 100% of it, is much more costly and justify the master piece price for example. But in industrial production or scale production, even service sector its excelente strategy to find the optimal enougth effort for overall outputs.
In other hand, if we talk about a new enhanced permanent cultivar like, coffee , palm oil or another, without production function, is very dificult to stablish the optimal amount of inputs, guessing that researcher haven´t that information.
Thanks you
Thank you David this was helpful
amazing information
As what I understand from segment 3 and 4, production function(s) is normally a function with y and ONLY one input variable (x) – x can be water, fertilizer, herbicide… Based on the production function we can find the optimal levels of x variables.
However, in reality, agriculture need all inputs (many x variable) at the same time. And these x variables can interact, boost the y (not just like when we apply only one x variable at the time). So, the ways we do to find the optimal levels of x (one by one based on production functions)–is it still true?
Thank you very much David.
That’s true, but there is still a flat area at the top of the multidimensional surface when you include multiple inputs.
Thanks David, this gave me a better understanding of optimal input level and it’s importance.
“Flat earth earth economics” 98% perfect title for a topic that impacts all fields of study
The part 3 and 4 has very helpful information for me, I read this when schooling but never had an opportunity to think about it in a practical grounds as I do now. Thanks for this David!
Thank you so much.
Agriculture needs all the inputs, but in certain proportions, it is determined based on the type of soil, its acidity or alkalinity, the climate and the appropriate crops for it, based on the studies of agricultural experts. These inputs are determined and farmers implement them practically under the supervision of agricultural engineers.
I agree that for a farmer to realize the expected quantity and quality at the right time, he needs to factor in a number of variables, some are more pronounced than others, for instance fertilizer (organic or synthetic), labor, pesticides (organic or inorganic), and water (especially dryland under irrigation), while others act as determinant factors to boost the performance of the major input, for instance, soil type, texture, level of acidity and alkalinity, location of the farmland and nature of the land. All these contribute to how the graph of marginal return will look at the end of a production cycle.