231 – Selecting environmental projects: prioritizing really matters
Almost all environmental programs are short of resources. Picking the best projects can make a huge difference to the benefits generated by a program.
There are more environmental projects available than can be afforded – often many more.
For example, a large national program in Australia recently funded around 5% of proposals received. Of course, proponents have already selected from among the available projects to some degree, so it was probably not more than 1% of potential projects that actually got funded.
Within the set of potential environmental projects, heterogeneity is enormous. They vary widely on every parameter: scale, feasibility, riskiness, importance to the community, likely compliance, costs, time frame, and so on.
As a result, the best projects are much, much better than the rest, meaning that programs can perform much better if they choose their projects well. Unfortunately, the importance of this is under-appreciated by most people involved in managing or participating in environmental programs. Many funded projects are mediocre, while great projects go unfunded or underfunded.
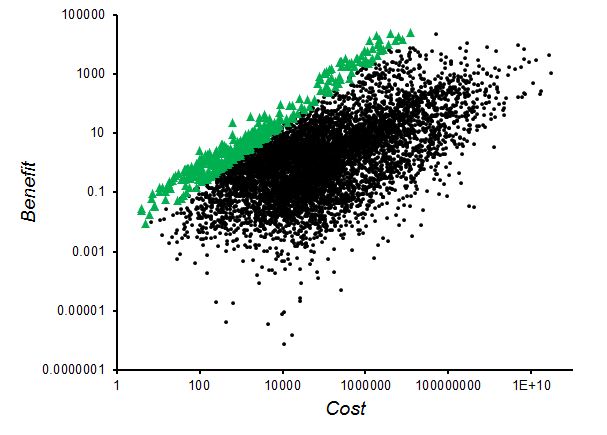
To illustrate how much it matters to focus resources on the best projects, the figure below shows a graph of the benefits and costs of around 7000 potential environmental projects in Australia (from Fuller et al. 2010, courtesy of Richard Fuller). Benefits are measured as the project’s contribution to protecting heavily cleared vegetation types. (See Fuller et al. 2010 for details.) It’s an incomplete measure of benefits, but it’s still useful to illustrate my point.
Note that the benefit and cost axes have been expressed in log scale to allow very small projects to be distinguished on a graph that includes some very large projects. The ranges of benefits and costs are enormous.
If we had enough money to fund 5% of the projects, the set that would generate the largest environmental projects would be the 5% with the highest Benefit: Cost Ratios (BCRs). These are shown as green triangles in the graph.
For this data set, the average BCR of the best 5% is 330 times greater than for the median project. For the best 10%, the ratio is 200 times.
Clearly, if a program faced with these 7000 potential projects fails to fund the best ones, the loss to the environment would be extremely large. From an environmental perspective, it would be well worth putting resources, time and effort into evaluating the projects to identify the best ones.
The quality of information and analysis required to do this successfully is significant. It’s certainly do-able (PD#185), and it’s well worth doing, but it’s rarely done. It requires the sort of analysis that underpins a good conservation tender. I don’t believe that the tender process itself is the key factor – it’s the information and analysis.
Of course, picking cases with large potential BCRs is not enough. Delivering the potential benefits also requires that:
- the project receives sufficient funding (see PD#210),
- the project is well designed with a good internal logic,
- the project uses appropriate delivery mechanisms,
- the project is well implemented, and
- the project is managed in an adaptive way to allow for learning.
But accurately picking the best projects is a great start.
Further reading
Boesso, G. And Kumar, K. (2007). Who or what really counts in a firm’s stakeholder environment: an investigation of stakeholder prioritization and reporting, “Marco Fanno” Working Paper N.51, IDEAS page for this paper
Fuller, R.A., McDonald-Madden, E., Wilson, K.A., Carwardine, J., Grantham, H.S., Watson, J.E.M., Klein, C.J., Green, D.C. & Possingham, H.P. 2010. Replacing underperforming protected areas achieves better conservation outcomes. Nature, 466, 365-367.
Pannell, D.J. (2011). Problems with environmental project prioritisation, Pannell Discussions 185. Here
Pannell, D.J. (2012). Under-estimating the costs of environmental protection, Pannell Discussions 210. Here

Dave, enjoyed this piece. One of the challenges I see is that prioritising happens at a number of levels. We have been doing evaluations of some of the C4OC projects and a problem we face is that of separating the assumptions inherent in a project being funded, from the delivery of the project. We have examples of projects where the delivery team have invested significant effort in ensuring they measure the relative benefits and costs of the actions presented to them (by land managers) so that they can select the best possible option. But the limitation is that they can only make the choices within the confines of the project as funded.
This effort does not mean that the project itself is necessarily a good option, i.e. that it’s one of the green triangles on the graph. This is a choice that’s made in a completely different environment- one where many imperatives are at work, some of which don’t sit well within the framework you’ve described above. I guess my point is that its worth acknowledging that sometimes the best a project delivery team can be expected to do is apply the principles you’ve described within their sphere of responsibility.
There needs to be continued pressure on the funding decision-makers and the regional NRM bodies to scrutinise their options (e.g. projects they seek funding for) more critically to make sure what they give their project delivery teams projects at least has some chance of being one of your ‘green triangles’.
Cheers
Shayne
Thanks Shayne. I agree that delivery of real benefits depends on various factors (see the list at the end of my post), and they interact. Yes, the initial choice of priorities has flow on consequences for what can be done in implementation of the projects. The first main round of CFOC competitive project funding (which would be the ones you’re looking at, I think) had a particularly poor application template which asked for almost none of the information you’d need for good prioritisation. As a result, the decision makers in government really had no chance of picking the green triangle projects.