208 – Ecological thresholds, uncertainty and decision making
The concept of thresholds features prominently in ecology and resilience theory. The idea is that if a variable crosses a threshold value, an ecological system can change abruptly and substantially. How this affects decisions made by rational environmental managers can depend greatly on how uncertain they are about the value of the threshold.
The Resilience Alliance has an online database of “Thresholds and Alternate States in Ecological and Social-Ecological Systems”. It contains many examples including:
 Coral bleaching on the Great Barrier Reef when temperature rises beyond a threshold level.
- Hypoxia (reduced oxygen concentration dissolved in water) in the Gulf of Mexico when the concentrations of nitrogen and phosphorus (largely originating from agricultural fertilizers) exceed thresholds.
- A switch from woodland to grassland in the Chobe National Park of Botswana when elephant numbers exceed a threshold.
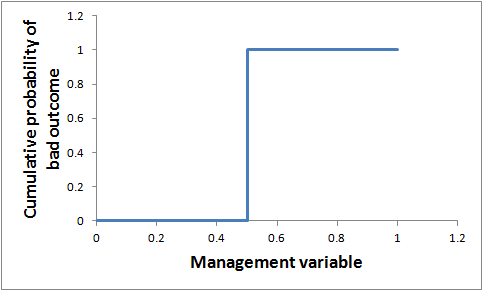
Thresholds are often talked about as if they are pretty black and white. If the variable is on one side of the threshold, the probability of a bad outcome is zero, whereas, if it is on the other side, the bad outcome is certain to occur (Figure 1). If you know that you are close to such a threshold, the benefits of taking action to avoid crossing it could be very high.
 For example, the decision might be, should we invest in actions to stop the management variable increasing slightly (moving to the right in Figure 1). If we know for sure that the variable currently has a value just below the threshold (e.g. 0.49 in this example), the benefits of investing in actions look high, as we can totally avoid the bad outcome.
In reality, though, when thinking about a decision that needs to be made about future management, we usually don’t know for sure whether there really is a clear-cut threshold, and even if we are willing to assume that there is one, we don’t know its value.
Instead, we might feel that there is a range of values that the threshold might take, and that these different values have different probabilities of actually being the threshold. In other words, we may be able to subjectively specify a probability distribution for the threshold.
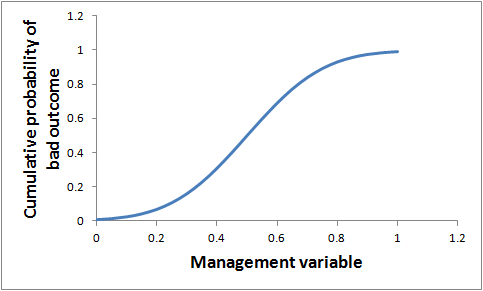
 To illustrate, Figure 2 shows how the cumulative probability of a bad outcome might look for a case where we believe there is a sharp threshold and our best-bet value for the threshold is 0.5, but we have high uncertainty about what the threshold value really is. In this case, the cumulative probability of a bad outcome increases smoothly and steadily until it reaches 1.
Decision theory was developed for just such a case. It’s a way to account rigorously for uncertainty about a variable when trying to make a decision about what to do. It says that we should weight the outcomes of our decisions by their probabilities of occurring, and base decisions on the “expected value” of the outcomes. “Expected value” means the weighted average, allowing for different possible outcomes and their probabilities.
If we apply that to a case where we are uncertain about what the threshold is (like Figure 2), then the expected value of avoiding a small increase in the management variable is not large, even if its current value is just below the best-bet value for the threshold. For example, in the numerical example in Figure 2, preventing an increase in the variable from 0.49 to 0.51 would reduce the probability of a bad outcome by only 4% (compared to 100% in Figure 1).
If allowing for uncertainty about the value of the threshold means that the estimated benefits of a management decision are very different, then the optimal decision about what to do could be quite different too.
Interestingly, even if you believe that there really is a sharp threshold, the effect of allowing for uncertainty about the value of the threshold is to smooth things out, so that the decision is no longer black and white, but is a shade of grey. The result is that the decision problem is rather similar to what it would be like if there wasn’t a sharp threshold at all, but a smooth transition between good and bad states.
To my mind, recognising realistic uncertainties about thresholds reduces their potency as an influence on decision making. It may result in reasonable decision makers choosing to take more measured actions than they would feel compelled to take if they believed that the problem was black and white.
Appendix
The following two figures are referred to in my reply to a comment below by Thomas Brinsmead. Ignore them unless you are reading that reply. The first figure is for a risk-neutral decision maker and the second one is for a risk-averse decision maker.


Hi Dave.
Your point is definitely valid, but there’s a bit of black-and-whiteness in your exposition that should be “shade-of-greyed”. The probabilities in your picture are not once-off probabilities akin to a coin-flip event, but cumulative probabilities relating to a series of actions over some (unspecified in your discussion) time horizon. So the decision problem does not relate to a “what to do now?” decision but “what to do next, and then after, and then after…?”
In our resilience paper looking at a threshold in the Goulburn Broken catchment (Walker et al 2010, ERE), every action had a marginal effect on the cumulative probability of flipping the system (crossing the threshold) within the time horizon. That brought marginal analysis back into the picture — instead of a marginal change in the state of the system, you had a marginal change in the cumulative probability of a non-marginal change ni the state of the system (if that makes sense).
So we restored a semblance of familiar marginal analysis to threshold problems. You could modify that with, on the one hand, threshold uncertainty of the type you describe, and on the other hand, risk attitudes. The fuzzier things get, the more we get into real options / precautionary territory ( think!).
Thanks Michael. No disagreement there. You’re basically reinforcing my point that, when you think about management decisions, you shouldn’t manage as if there is a cliff edge. The probabilities mean that it’s more of a hill slope.
David
This is not new stuff. There is a whole literature on this in resource economics that began by looking at discontinuities as phosphorous loadings in shallow lakes increased to a threshold where the entire ecology of the lake changed. The theory is quite mathematical but very interesting. A review of papers on the topic of non-convex ecosystems with applications to forestry, agriculture, etc. appears in a special issue of Environmental and Resource Economics, Vol. 26, 2003.
Thanks Kees. I wasn’t aware of that special issue. But there are certainly no claims to newness here.
Dave, we’re certainly agreeing, so the question is who we’re disagreeing with! Are there really people treating it (existence or high likelihood of a threshold effect) as something that fudamentally changes “the optimal decision” of a manager?
It’s simply a mis-specification of a fundamentally dynamic problem where decisions/actions over time have cumulative effects, which shift around the probability distribution of outcomes. (In our paper, which stemmed from the work Kees has identified from that 2003 special issue of ERE, we “collapsed” the dynamics into the cumulative probability function, much as you’ve done above — but it’s still not a static or one-shot problem.)
There are other historical antecedents, it seems to me, including the “optimal stopping” class of problems which go back somewhat further.
Anyway, once you get into this stochastic, dynamic world, the intuition changes from the conventional stories we’re used to. For example, the proposition you put “If you know that you are close to such a threshold, the benefits of taking action to avoid crossing it could be very high”, while appropriately cautiously worded, may be simply incorrect. Something we discussed (without proving) in our 2010 paper, is the potential for a fundamental non-monotonicity around thresholds. That is, if you’re very close to the edge of a cliff in a dynamic system subject to shocks, the benefits of a marginal bit of remedial action may in fact be very low. (The odds are high you’ll go over the cliff in the near future anyway!) There may be an “optimal range” of distance-from-threshold where one would want to be quite interventionist, whereas too close, one could be fatalistic, and too far away, one could be sanguine.
Perhaps next time you come east, we need to pick this up over beers and figure out how to embed it in INFFER, because as you can see, I’m inclined to bang on about it a bit. 😉
Michael, I guess what I’m trying to do is put people on their guard if they are thinking about the threshold concept in the context of environmental decision making. Not researchers who’ve thought about it deeply already, but environmental managers or stakeholders who are being exposed to the threshold concept but may not have been exposed to formal methods for thinking about uncertainty (or dynamics, as you say) in decision making. There are many such people in Australia at the moment. Thus, I don’t think I’m disagreeing with anyone, specifically. I’ll look forward to those beers (and the banging on).
Hi Dave
Your discussion of ecological thresholds and the lack of attention given to uncertainty (and expected value) seems to me, to have many analogies to the research I’ve been doing into bushfire management and policy. Bushfire management (like ecosystem management) can be very emotive which I think is why a catastrophic fire event (or reaching an ecological threshold) will often be thought about as if it has a probability of 100%.
As a forum for publishing economic perspectives on ecological thresholds, you might be interested in the Call for Papers just announced from Environmental Conservation for a themed journal issue on ‘Politics, Science and Policy of Reference Points for Resource Management’. Papers due Sept 2012.
The key point is well made – and relevant. If the location of a threshold is uncertain (and provided expected value is the means of aggregating over uncertainty) then the effect of the uncertainty is to make the decision problem less sharp.
On the other hand, implicit in Helena’s remark is that if the costs of exceeding the threshold are large, expected value is not necessarily an appropriate means of aggregating over the uncertainty. A risk averse approach might increase the probability weighting on high cost events. But the effect of this would be effectively to recover the original shape (though the location of the sharp rise in risk-averse-weighted expected cost would be (in this example), lower.
This is one means of recovering the intuition of natural resource managers that a combination of thresholds and uncertainty means you keep well away from where you think the threshold might lie. (The “cliff edge” metaphor is apt. If we assume that getting closer to the edge enables you to collect a few more berries, but falling off the edge is certain death, then a rationally risk averse berry collector in the fog will keep well away from where that cliff edge might be).
As an additional bonus from the point of view of researchers applying for grant funding, the value of more accurately locating an uncertain threshold can therefore be quite high. (If the berry collector can reduce the uncertainty of the cliff edge from 1km to 100m, there is an extra 900m of edge that can now be exploited.
Thanks Thomas. Interesting comment, which set me thinking. I think you’re partly right, but not totally.
My response is unavoidably somewhat technical – sorry for that. It is based on standard decision theory, relying on subjective expected utility (SEU) theory to represent risk aversion. SEU is not without controversy, as it’s been shown that real people often violate it. However, it has the significant advantage of being developed from a set of very reasonable axioms, and can be considered to represent how risk aversion would work if people were fully rational. It’s the standard textbook approach.
So, if you apply SEU to the issue, the effect of risk aversion is to increase the weight given to bad outcomes, relative to good outcomes. Strictly speaking, it’s not the probabilities that are weighted, it’s the outcomes. (Side comment: weighting the probabilities happens in a different form of utility theory that tries to capture some of the anomalies that real people exhibit, but it’s more of a theoretical curio, rather than a practical approach, in my view.) The result of increasing the weight given to bad outcomes is that the benefits of taking more intense management actions (to move away from the cliff edge) increase relative to the benefits of taking less intense management actions. Overall, this means that the optimal intensity of management increases, resulting in a retreat from where you think the cliff might be.
I’d like to show some figures to illustrate how this works. It seems that I can’t include figures in this reply, so I’ve stuck them in an appendix at the end of the original post (above).
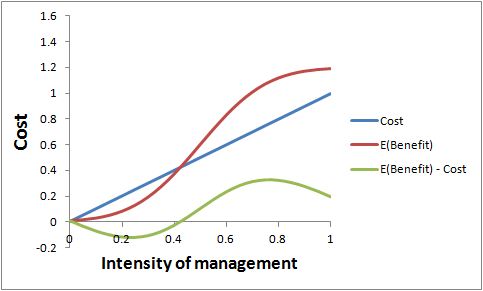
The first figure illustrates the benefits (in red) and costs (in blue) of taking management actions of different intensities, if the decision maker is not risk-averse. The benefits are expected benefits, in the statistical sense of being weighted by probabilities, based on the probabilities in the second graph in the original post. The green line shows the expected net benefits. For this numerical example, the optimal intensity of management is 0.75. That’s where expected benefits exceed costs by the greatest amount.
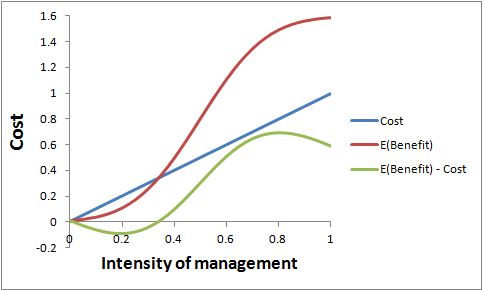
The second figure shows the same problem if the decision maker is risk averse. The weight given to bad outcomes has been increased, and the expected benefits have been scaled up accordingly. Costs are unchanged. Expected net benefits are broadly the same shape as before, but the peak has been moved a little to the right, to 0.8. That’s the new optimal management intensity.
Notably, in that little numerical example, I gave a quite a high weight for risk aversion, but the effect on optimal management was small. The reason is that the expected benefits curve has not changed shape fundamentally, it has just been scaled up.
You can see that introducing risk aversion to the problem does not recover the original cliff-like shape of the pay-off function after all. It is still a hill slope. Risk aversion does make you want to move away from the cliff edge, but perhaps not by as much as you might have expected.
(It is true, using actual numerical calculations did produce results contrary to my expectations!) Your reply and general conclusions are quite valid for the case where the costs and benefits under consideration are of a similar order of magnitude, as in your example.
In my earlier comment, I was in fact thinking of the (perhaps more “academic”) case of weighting the probabilities rather than the utilities, inspired by Tversky and Wakker (1995) “Risk. Attitudes and Decision Weights”, Econometrica. Being more of an armchair theorist in the decision making field, I won’t comment on practical implementability.
However, in this particular toy example, the deterministic utility (of the costs) takes on one of two values, so we could get qualitatively similar results from
a) reweighting probabilities – but I see that large factors would be required to produce the results that I want to claim, b) reweighting negative costs to become high negative utilities – but again, large factors would be required or c) deterministic costs that are large to begin with. (Having thought this through, I see that the effects of the reweighting probabilities is to somewhat smear out the tail of the expected utilities towards the left).
If the costs of exceeding the threshold were of the order of 10 or more times the corresponding benefits (rather than about 1.5 as in your example), then we’d see a significant shift to the left of the optimal management target, and also high value benefits of research to identify the location of the threshold.
Again, having now thought this through, the key feature about thresholds is that the empirical marginal cost of changing the management action in the pre-threshold range of management action is a very poor proxy for marginal (expected) cost (even in the prescence of uncertainty) near the threshold region, IF the costs of exceeding the threshold are catastrophic.
And that might well depend on scale – losing a lake to eutrophication might be disastrous from the point of view of the lakeside households (or a species of rare fish for which it is a unique habitat), but a minor matter for the tourism industry (there are lots of other clear lakes, or for a more common fish species with an extended habitat range.
On the other hand, often when we are talking about significant thresholds, we can mean catastrophic ones (eg Lenton et al 2008, “Tipping elements in the Earth’s climate system”, PNAS, on global climate change thresholds.)
Furthermore, because of the hysteresis dynamics of thresholds (irreversibility), it’s not a good idea as a management strategy to simply “try and see” where the threshold lies, with the intention of pulling back slightly after having gone too far. Much more sensible to model (good – more research grants!) and manage conservatively. [It makes no more sense to do empirical verification than it would for me to verify my hypothesis that carbon monoxide poisoning is likely to be fatal for me specifically.]
Your key point however, is also true. Even though irreversible, IF the costs of exceeding a threshold are modest, then effect of uncertainty about the precise location of that threshold is to moderate the sharpness of the (uncertainty weighted) payoff as a function of management action.
So perhaps a wider lesson to take away here – for general conclusions, it is not just the underlying dynamics that matter, but also the relative magnitudes of the significance (“utilities”) of the potential outcomes.
It is certainly the case that, the greater the costs from crossing the uncertain threshold, the higher is the optimal management intensity, and so the further from the threshold it is best to operate.
You seem to be arguing that this reflects my model breaking down, but I don’t really see that. That result arises within my model. Sure, the expected benefits curve becomes steeper, but it’s still the same shape, just scaled up.
I am also prompted to wonder how commonly one would find the expected benefits curve being so drastically higher than the cost curve as you are positing. My observation is that the costs of major environmental projects are generally high – often much higher than people seem to expect. We often try to get away with running such projects on a shoestring and then are disappointed (and, more worryingly, surprised) about the poor results.
(Assuming I’m replying to a reply to my earlier post)
I did not intend to suggest that the structure of the (reasonably plausible) model that you propose breaks down on the use of significantly different parameter values. Rather I was making the rather (unremarkable) remark(?) that a hastily drawn qualitative conclusion from any particular example may change if the parameter values are sufficiently extreme.
In particular the (succcinct) conclusion “introducing risk aversion does not recover the original cliff-like shape of the payoff function” and “risk aversion doesn’t make you want to move away from the cliff edge very much” is true for the parameter values that were selected in the numerical example.
And I’m happy to believe that such relative order of magnitude of costs and benefits apply in many practical cases.
The particular point that I was emphasising is as follows. In the (certainly theoretically possible, plausibly practically possible for at least a few non-trivial examples) case where the benefits of an environmental project (costs of not being green-minded) are extremely large, payoff function IS cliff-like (I’ll assume that we are agreeing roughly on how to interpret “cliff-like”-ness) and risk aversion can move the payoff function cliff-edge (optimal management) a more significant distance away from a cliff edge in the probability of threshold crossing function.
Particular examples where this might occur is when the environmental costs are “existential” – Farmer Brown destroys the grazing pastures completely my overloading with cattle by a few percent. Granted there may also be many examples where the alternative relative value magnitudes are involved: Farmer Jones considers whether to install an additional oxygenation pump to reduce the risk of dam eutrophication, and losing access to the eels that are enjoyed for Sunday lunch.
Nothing more profound (or controversial) than that.
Great discussion, many thanks for initiating it Dave, and thanks too for the highly informative comments from yourself and others.
Most decisions about managing a biophysical threshold will also have time thresholds attached – when is action too late, and at what time do we decide to act? Actual, as opposed to theoretical decisions about managing big thresholds with very nasty potential consequences are not of course made by a rational decision maker, but by multiple agents in social systems hobbled by misperceptions, denial, special interests, other social priorities etc. While we have been aware of the potential consequences of greenhouse gas emissions for a century or so, particularly in the last two decades, social inaction carries us closer to some probably ugly thresholds. Weighting for the expected time delay would increase the value of early investment in change.